Showing posts with label Charts. Show all posts

Wednesday, 22 August 2012

Closing off Indoagri position and STI update


I closed off my Indoagri position yesterday and today at average of 1.44. Time to stay aside and watch again.

My "sell" signals are triggered for STI, and i think STI is due for some correction and consolidation.

CDL H Trust

It is interesting to note how 'stocks' are closely correlated. One case in example will be the listing of Far East Hospitality Trust which will be a direct competitor of CDL H Trust.


CDL H Trust has been under selling pressure in recent days after Far East Hospitality Trust announced its IPO and investors could be 'rebalancing' out of CDL H Trust into FEHT. The market is probably trying to find an equilibrium price where investors will be indifferent between holding this and FEHT. If FEHT had been priced way below 93c, the selling pressure on CDL HT might have been more intense as it will be more attractive to hold FEHT instead of CDL HT. 

In any case, the decline in CDL HT is not as bad as the decline in my "Facebook like" or the share price of Facebook itself. haha.
Can someone help me stem the decline? :-P


Tuesday, 14 August 2012

Ezra and Indoagri - Update

Ezra has a nice run up today from the time i first spotted it.


Unfortunately my lack of patience is terrible..  :-( This blog is my diary on how i should improve my trading...and no time to monitor the market shouldn't be my excuse..... :-) 

Lessons to take away:

1. Extend my time horizon and be more patient since the sell signals wasn't triggered on my chart yet.

2. Ride the profits of Sakari and Ezra using a trailing stop.

Ezra is probably heading towards 110, thus if am still holding it, i will probably take 1/2 off the table at around 105 and ride the rest using a trailing stop. I will move the stop of Ezra to around 102 from 94.

Indoagri moved up from my initial entry yesterday. Too bad it didn't close at its high today, probably some traders will not want to play with results announcements. Hopefully the results announced today will help give it a boost.... (fingers crossed)... 


First take on results of IFAR by GS


Monday, 13 August 2012

IndoAgri Chart

I thought the chart for Indoagri looks interesting.  Target around 1.48. Cut loss around 1.35. Vested.


The list of analyst coverage enclosed for information.


SMRT chart

The SMRT Chart actually looks pretty good. While the COI hearing is over (and the key beneficiaries are probably the lawyers), the support at 1.60 is protected. I was actually seriously contemplating buying this for my SRS fund if it drops further but was put off by the current price where the PE is > 20x and the yield is around 4.5%. With a potential overhaul in 'maintenance' regime, probably the operating costs will increase in the coming years but the smrt continues to be the main mode of transport for Singapore and is a 'legal monopoly'. Perhaps a high PE is somewhat justifiable?

A possible swing trade will be a cut loss below 1.60 and a target of 1.70 or higher. If 1.72 is taken out, then probably it will head towards 1.80 area.

Wednesday, 1 August 2012

STI Update - 1 Aug 2012

STI looked like it is going to have a National Day Rally! It broke above the key 3,035 resistance after 4 failed attempts that lasted since March this year. Usually, if a resistance breaks after 3 attempts, I would classify it as a significant break. This is somewhat surprising since the situation in Europe is still unclear but something you may want to bear in mind is that stock market usually moves 6-9 months ahead of fundamentals. Happy trading!

Ezra & Sakari

Sakari - I nibbled some shares yesterday and today. My cut loss below the green line and the target $1.40 and above. Disclaimer applies. Sakari is very volatile and has a very high beta.


Ezra - Again i nibbled some shares yesterday and today. Cut loss below 95 and target 105 or better. Not sure how the trades will turn out. As usual, do your own homework and please don't follow my trades as my costs are lower.

Thursday, 26 July 2012

STI Update

The STI is pretty undecided as you can see by the long tail it formed today. I would have called this a potential shooting star in candlestick term if it had occurred at the top of the trend. The parabolic is still in the bearish mode and STI seemed to be waiting for something to happen?! Anyway, watch your stops while you trade. The market can get a little whippy from here, maybe affected by sentiments in the US reporting season although i have to admit that the undertone seemed to be firm.


I have decided to continue posting my views but probably not the trades as they are not timely and the timeframe is very different... and it may cause more harm than good and may act as an unnecessary inducement to trade even though i have a disclaimer on top.... but no worries, i will continue to share whenever the time permits. Happy trading.

Monday, 23 July 2012

STI, CapMallAsia and Capitaland

Lets do a quick recap on my previous postings:

CapMallAsia hit my first target of 1.55 today. There is still some way for this correction to run and will probably head towards my second target.


STI - As mentioned in my update yesterday, i am bearish on the STI and has initiated a short position via July SIMSCI this morning. STI is probably heading towards 2950 followed by 2900.


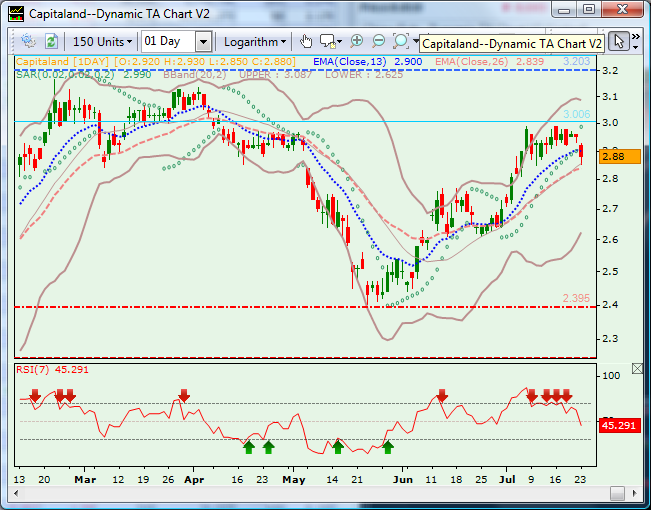
Capitaland - Initiate a short position in Capitaland at 288. First target at 275 followed by 260. Cut loss just above recent high.  


Overall, i think the market sentiments is weak and many stocks look very weak to me. So do take precaution if you intend to take long positions.

STI update

My personal view on STI - Continue to tighten your stop  on STI as it looks weak and a short term correction is imminent in the coming days.  


Monday, 16 July 2012

CapMallsAsia - Chart review

The CapMallsAsia chart looks interesting. It look likes correction is going to start and i quite like the set up for a "short" trade. First target is 1.55, followed by 1.45-1.50 range. The cut loss should be around the recent high.

Friday, 13 July 2012

OCBC Bank

The OCBC chart looks pretty impressive as it breaks the key $9 resistance today. A simple projection means a possible target price of $9.80 or better in the coming weeks/months.

Wednesday, 11 July 2012

STI update

The STI recovered strongly today even though US markets were weak last night. The undertone is firm and underwriters would want the buoyant mood to continue so that they can launch the IPOs. Many companies are trying to catch this window and 2 business trusts have lodged their prospectus with SGX in recent days. STI continues to look healthy and may test the 3,000-3,300 range in the coming days. A convincing break above 3,300 will be bullish as it has failed to cross that in the previous few attempts. Having said that, the resistance is a strong one. Traders may want to tighten their stops as the STI runs up.

Tuesday, 10 July 2012

STI - Tighten your stops.

It might be a good idea to tighten the stops around your positions in STI. The parabolic is in danger of being triggered in the coming days.
Related Posts Plugin for WordPress, Blogger...

Google Analytics