A very nice cup and handle pattern. This is a bullish pattern. Enjoy the ride...
Tuesday, 16 October 2012
Wednesday, 3 October 2012
No 3 No 4 ?
I haven't been trading actively since my last posting to share with you how to watch out for the "stars".
For the last 2 weeks, the market was probably in a no 3 no 4 (不三不四) situation where it was neither going up nor breaking down. It is basically in state of confusion and in a limbo until we can see a clear winner between the bulls and the bears. I will probably continue to stay on the sidelines until i can see trades that give me a better risk-reward ratio.
Straits Times Index
Let's do a quick recap on STI. My previous post was here. 3088 seems to be a nice 4-D number and a pretty strong resistance. It seems unclear whether STI is going to break above 3,090 to resume its bull run or consolidate sideways and form a double top but i will watch the show from the sidelines.
Ezion
Ezion seemed to be undergoing a correction after its strong run up. It has almost doubled in price 4 months! What a spectacular run. Traders who are keen on this sector can probably wait for the correction to finish its course before getting back in again. I think it will likely do a correction in the coming days.
STX OSV
Very interesting counter. I am interested to buy this for my SRS portfolio but the major shareholders are 'selling real hard'. I will see how this goes.
Olam
One reader asked for my view on Olam. I think Olam is trading sideways with downward bias towards the $1.90 level. No change to my earlier views.
It is always difficult for me to give a view because I am unable to advise on your own risk tolerance and investment horizon. I will share a topic on risk and reward next time. You have to know your own risk and reward each time you enter a trading position. If the risk versus reward is not good, then just give it a miss. I see some traders risking a large amount of capital for a small profit (example buying 500 lots for a 2 bids movement). Well my only kind advice is that make sure you can cut loss before you move to this level. This "level" is for the 'professional' scalpers who can monitor the market closely. It will not be suitable for traders with limited capital outlay or traders who have difficulty cutting losses quickly.
Happy trading.
Monday, 24 September 2012
Importance of Closing Prices
It's Ninja Lesson time.
I am not sure if you have heard of the quote before
"Amateurs open the market, but professionals close it".
In short term trading, closing prices are more important than opening prices. It tells your the force behind the price movement and whether the price is weak or strong.
Who sets the opening price? Usually it will be people who have read the news (such as results or news announcement) the night before and then put in their orders early in the morning before market opens.
Who sets the closing prices? Usually, it will be the professionals or market players who determine how and where the prices should close. They have their reasons for wanting to close the prices at a certain level and they usually come into the market nearer to its closing time. Which is why sometimes you see a spike in volume after 4pm for the Singapore market and you can even see some stocks closing 2-3 bids higher than the last traded price between 5 to 5.05pm. This is just one example.
Some examples of "professionals" who set the closing prices.
Case study 1 - business owners who have pledged their shares for loan.
Case study 2 - Fund managers who buy the shares near the close of the market. The more obvious ones are found guilty and the more subtle ones get away. :-P
Case study 3 - Fund manager who window dress.
Examples of other types of instruments besides stocks and shares - Oil price is rigged. LIBOR is rigged. Gold price is rigged. hahaha
I have shown you all the 'negative' examples but you can probably get the idea as to why closing prices are more important than opening prices.
On a more positive note, it can also mean that the stock is gaining a lot of attention and fund managers and retail investors alike are piling into the counter. Probably this can help explain the rise in Far East Hospitality today? :)
Happy trading.
Tuesday, 18 September 2012
The stars are starting to appear for some stocks..
You must be wondering why i wrote this post last evening about looking out for shooting stars and evening stars etc. This is because this is usually the first sign that the market is undecided and hints of possible corrections.
Some of them have appeared and if you are a trader, it will be good to tighten your stops when a doji or shooting star first appear.
Just scan through the charts and i am sure you can catch some of them. I share some of them with you so that you know how to spot them yourself.
Evening star - Noble. A possible correction back to the 1.25-1.28 region
Shooting star - Olam. A possible correction back to the 1.90-2.00 region.
Evening doji star - SC Global. A possible correction back to the 1.05-1.10 region
Happy stars gazing.
Monday, 17 September 2012
Look out for the shooting stars!
There are a few phenomenons in the stock market which you may want to watch out for to determine if the bull run is coming to an end soon. It is like an early-warning system.
Whenever you see many penny stocks running, it is time to take money off the table.

What are the few phenomenons i will watch out for?
1. The pennies start to run.
Be very wary when the penny stocks suddenly come alive and hog the top 20 volume counters. These are usually stocks that have no fundamentals to begin with and are what the hokkiens will say "5 cents 10 cents" stocks.
My definition of penny stocks are stocks that are very cheap in monetary terms but expensive in valuation terms. In other words, they may only be trading at 10 cents but the reason why they are trading at 10c is because they are usually loss making or trading at have very high PEs. These stocks will usually start to run only after the blue chips and good stocks have 'finish running' and the profits made from those stocks are now being rotated into the penny stocks.
Whenever you see many penny stocks running, it is time to take money off the table.
2. You start to see stars!
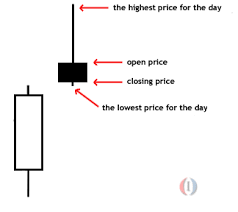
If the stocks you are invested in start to show you stars, it will be a good idea to tighten your stops. You can check out the different types of bearish stars here. Two types of stars are presented below for your reference.
| Shooting star |
| Evening star |
It can be a shooting star, it can be evening star and they usually appear at the end of an extended run. Be wary when the stars start to appear!
3. Taxi uncles and housewives comes to the market
The above is a generalization. I am sure there are many educated tax drivers and sophisticated housewives. (so pardon me if you belong to this category. haha).
Basically it means people who never touch the market starts to flock to the stock market thinking there is easy money to be made. For example if someone who doesn't dabble in stock suddenly starts to tell you what stocks to buy. You know the end is near!
4. When newspapers headlines are very bullish.
Usually you will see many bullish headlines at the peak. The reverse for a stock market bottom is true too!
Here you go. I have shared with you the various symptoms which you should look out for. You will be able to see it when it comes.
Happy investing.
Closing off position - Sarin
Diamonds are forever but not this position of mine.
I have adopted trading strategy (3) and unloaded all my position in Sarin at 105 :)
Happy trading.
Sunday, 16 September 2012
CapMallsAsia & JB Foods
A possible swing trade back to 1.70 or better with a cut loss below 1.60?
Interesting to see that JB Foods have finally turned "positive". Perhaps it is because the CEO started buying at 1m shares 29c recently. It has also recommended a 1c interim dividend. Probably can see higher prices in the coming days?
Subscribe to:
Posts (Atom)